FxPro Raw+ Live Spreads — Measured, Not Advertised
Real spreads we recorded on FxPro’s own MetaTrader 5 Raw+ feed — 6 instruments, 3,399,055 ticks sampled, last captured 2026-08-09. The spread you actually trade on, not a marketing ‘from 0.0’.
Open FxPro Account →On a practice account the cost of a trade is visible and weightless at the same time: the number is right there on the ticket, and it comes out of a balance that was never yours. That is why beginners can rehearse for weeks and still be surprised by the first live month - not by the size of the cost, which is measured and published above, but by the fact that they now notice it. The habit worth building while still practising is small: read the cost line before you confirm the order, and write what you expected to pay into the journal at entry. A month later that one line is what lets you say whether cost ever changed a decision, or whether you simply learned to look at it.
This is the live, hour-by-hour measured spread feed (refreshed daily). For the Standard vs Raw+ cost comparison and fees, see our spreads & costs page.
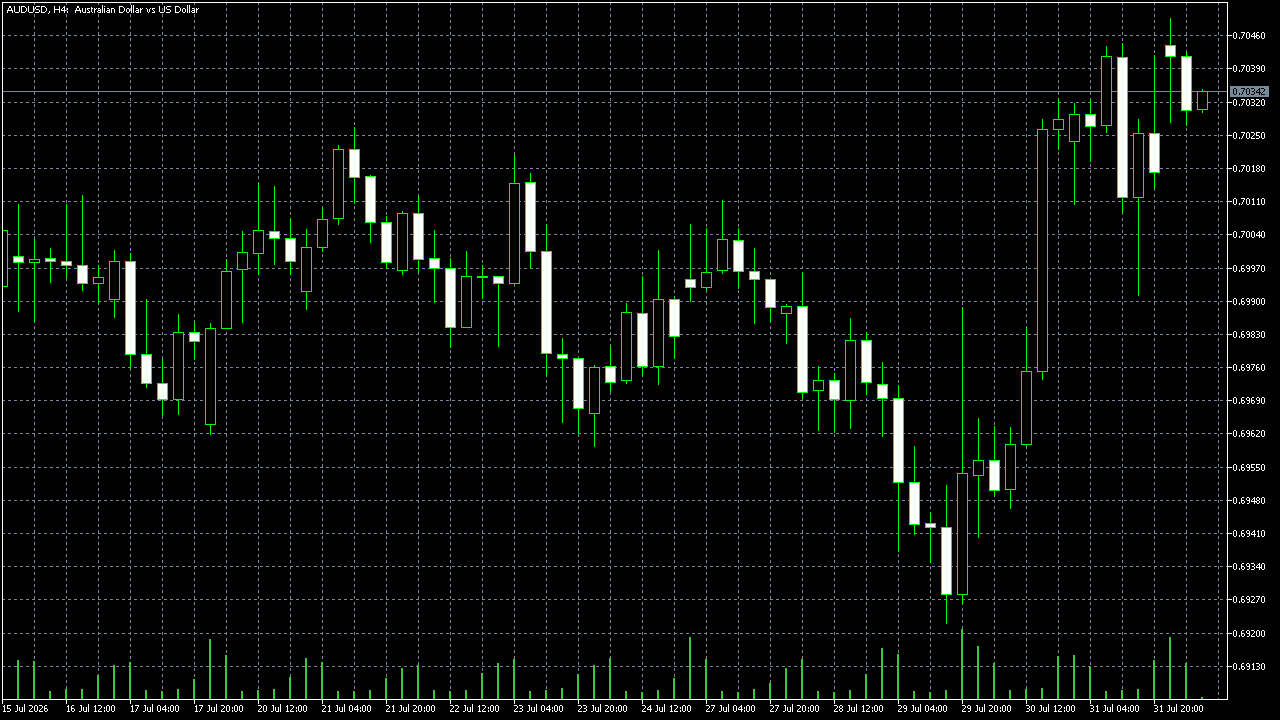
Measured Raw+ spreads (pips)
| Instrument | Best (min) | Typical (median) | Busy market (p90) | At capture | Ticks sampled |
|---|---|---|---|---|---|
| EUR/USD | 0.2 | 0.2 | 0.2 | 0.3 | 391,192 |
| GBP/USD | 0.6 | 0.6 | 0.6 | 0.7 | 542,359 |
| AUD/USD | 0.2 | 0.4 | 0.8 | 0.3 | 460,160 |
| USD/CAD | 0.1 | 0.4 | 0.5 | 0.2 | 468,810 |
| USD/JPY | 0.3 | 0.3 | 0.5 | 0.4 | 529,273 |
| XAU/USD (Gold) | 15 | 15 | 19 | 16 | 1,007,261 |
Best = the tightest quiet-market quote we saw; Typical = the median you usually trade; Busy market = the wider spread to expect about 10% of the time (news, rollover, thin liquidity). ‘At capture’ is the live spread at the last reading. Metals such as XAU/USD use a different contract size, so their cash cost is on our gold page. Server FxPro-MT5 Demo, feed 2026.08.07 23:59:35.
Spread through the trading day (measured, last 24h)
| Instrument | Tightest (avg) | Widest (avg) | Worst spike | Through the day |
|---|---|---|---|---|
| EUR/USD | 0.2 (02:00) | 0.939 (23:00) | 6.2 (23:00) | |
| GBP/USD | 0.6 (03:00) | 5.359 (23:00) | 15 (23:00) | |
| AUD/USD | 0.293 (07:00) | 5.204 (23:00) | 25 (23:00) | |
| USD/CAD | 0.294 (20:00) | 4.812 (23:00) | 18.2 (22:00) | |
| USD/JPY | 0.3 (08:00) | 5.191 (23:00) | 15 (23:00) | |
| XAU/USD (Gold) | 15 (08:00) | 35.101 (00:00) | 175 (00:00) |
Table hours are FxPro server time (about UTC+3 / EET); the highlighted guidance above is shown in IST. Average pip spread by hour over the last 24 hours, with the worst single-tick spike. Spreads run tightest in the peak London–New York overlap and widen around the 00:00 server rollover and the thinner Asian hours — the sparkline is each instrument’s daily shape.
What it costs you per lot (Raw+)
| Instrument | Typical spread | Spread cost / lot | Commission (round turn) | All-in / lot | All-in (pips) |
|---|---|---|---|---|---|
| EUR/USD | 0.2 pips | $2.00 | $7.00 | $9.00 | 0.9 pips |
| GBP/USD | 0.6 pips | $6.00 | $7.00 | $13.00 | 1.3 pips |
| AUD/USD | 0.4 pips | $4.00 | $7.00 | $11.00 | 1.1 pips |
| USD/CAD | 0.4 pips | $2.87 | $7.00 | $9.87 | 1.38 pips |
| USD/JPY | 0.3 pips | $1.90 | $7.00 | $8.90 | 1.4 pips |
| XAU/USD (Gold) | 15 pips | $15.00 | $7.00 | $22.00 | 22 pips |
All-in round-turn cost for one standard lot (100,000 units): typical spread × pip value, plus the $7 Raw+ commission ($3.50 per lot per side ($7.00 round turn) on Raw+ and cTrader accounts). On a Standard account you pay a wider spread instead of that commission — see the full spreads and costs page.
Open FxPro Account →Advertised ‘from 0.0’ vs what we measured
FxPro markets Raw+ as spreads ‘from 0.0 pips’ — a best-case floor. Across our sample the tightest EUR/USD quote we recorded was 0.2 pips and the typical was 0.2 pips. That is normal: the ‘from’ figure is a floor you rarely trade on, so judge a Raw+ account by its typical spread and how far it widens under load (the p90 column), not the headline number.
How we measured this
- Recorded on FxPro's own MetaTrader 5 Raw+ account — the broker's real pricing feed, not a third-party estimate.
- Captured in-terminal by an MQL5 expert advisor that logs every tick's bid and ask, so the spread is exactly what the platform shows.
- 3,399,055 ticks across 6 instruments; the figures refresh on a schedule.
- Demo and live Raw+ share the same pricing feed, so these spreads are representative of a funded account.
Spreads are variable and widen around high-impact news and the daily rollover. Past readings do not guarantee future spreads. Last updated 2026-08-09.
Reading the cost line while it still costs nothing
The measured figures above come from the same feed a funded account trades on, so there is no version of this you have to wait for. What practice gives you is the chance to build the reading habit before it carries any weight - glance at the spread, decide whether the idea still makes sense at that number, then confirm the order.
Do it on every practice order, including the ones where the answer is obviously yes. A habit that only appears on difficult trades is not a habit; it is a reaction, and reactions are the first thing to go when the account is real.
One caveat worth checking early: know which pricing model your practice account uses. If the cost line looks nothing like the one you will meet on a funded account, the habit still transfers but the numbers in your journal will not compare. The cost breakdown lays out how the two models price the same trade.
The journal line that makes cost reviewable
Write the cost you expected to pay, at entry, before the outcome is known. It takes three seconds and it is the only version of that number that has not been edited by hindsight.
Add a second line only when the cost changed something - a size you trimmed, an entry you skipped, an hour you waited for. Those lines are rare in a first month, and their rarity is itself the finding.
What you are building is a record of attention rather than of arithmetic. The all-in figures above are already accurate; nothing you write improves them. What is missing from the platform, and only from the platform, is whether the number in front of you was doing any work at the moment you pressed the button.
Cost problems that arrive disguised as something else
The most common one looks like impatience. A trader who enters, exits and re-enters the same idea three times in a session has paid to be in that market three times, and the history shows the round trips even though nothing in the journal mentions cost at all.
The second looks like variety. Entries scattered across unfamiliar instruments usually mean the cost of each was never checked, because checking implies knowing what normal looks like on that symbol. Narrowing down to one instrument for a month fixes both problems at once, which is what the single-pair page is for.
The third looks like timing, and it is the one to be careful about diagnosing. Entering when the market is thin costs more than entering when it is not, but that is only a mistake if the hour was accidental. The journal line at entry is what separates a deliberate choice from a habit built around when you happen to be free - and the hours page is where that question belongs.
Building the cost habit before it costs anything
- Read the spread on the ticket before confirming every practice order, without exception, until the glance is automatic.
- Write the cost you expected to pay into the journal at entry, in the same wording each time.
- Add a second line only on the trades where cost actually changed what you did, and leave it blank otherwise - blanks are data too.
- Once live, keep both lines running unchanged for a full month, so the first live record compares directly with the practice one.
- At the weekly review, count how many entries mention cost at all, and read what those few decisions had in common.
Nothing here improves the measured numbers above. All of it improves whether they were in the room when you decided.
What practice teaches about cost, and what it cannot
| Aspect of cost | Learned in practice? | What the first live month adds |
|---|---|---|
| Where the number appears on the ticket | Yes - identical layout | Nothing; this part transfers whole |
| Roughly what normal looks like on a symbol | Yes, with repetition | Only that you now check it |
| Whether the number changes a decision | No | The rare entries where it plainly did |
| Whether you re-enter the same idea repeatedly | Visible, but painless | The same pattern, now paid for |
| Whether the cost was worth the trade | Not answerable | A month of entries read back together |
The reading habit is free to build and transfers intact. The noticing is the part that only starts when the balance is yours.
Journal lines about cost and what each one is for
| Line | Written when | What it answers at review |
|---|---|---|
| Cost I expected to pay | At entry, every trade | Whether the number was even looked at |
| Cost changed my decision | At entry, only when true | How often cost does any work at all |
| Instrument and why this one | At entry | Whether unfamiliar symbols are being priced blind |
| Re-entry on the same idea | At entry, when it applies | How much of the month was paid for twice |
| Hour chosen or hour available | At entry | Whether timing is a decision or a schedule |
Five lines, all written before the outcome. Read a week later they describe the month far better than the balance does.